What did I do this week ?
The coding phase for GSOC’24 finally started from 27th May, the goal for the week was to develop a working demo for the matplotlib based renderer.
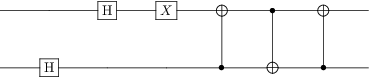
Current LaTeX-Based Visualization:
Here is an example of a circuit visualized using the current LaTeX-based approach. One thing to note is the placement of the “H” gate. In this visualization, “H” gates can be placed in the same X-position to reduce the circuit’s overall size and make it more realistic.
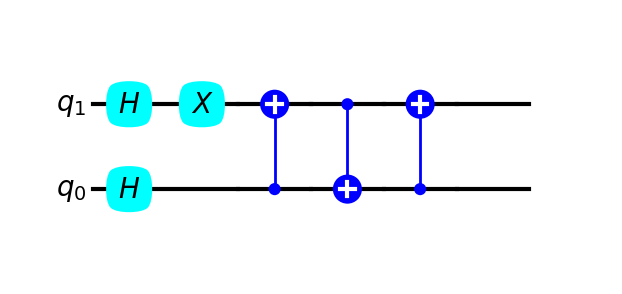
Matplotlib-Based Renderer Concept Demo:
I utilized matplotlib’s patches class utlized for adding different geometric shapes to the fihgre canvas and some other functionalities from artistto build the circuit in layer based approach. For the demo, I have implemented only different single qubit gates and CNOT. The code uses a dictionary to keep track of the number of gates placed on a particular wire. If there is no space in the current horizontal layer, the new gate is shifted to the next horizontal layer. This method enables the parallel display of gates, enhancing the visualization’s clarity and compactness.
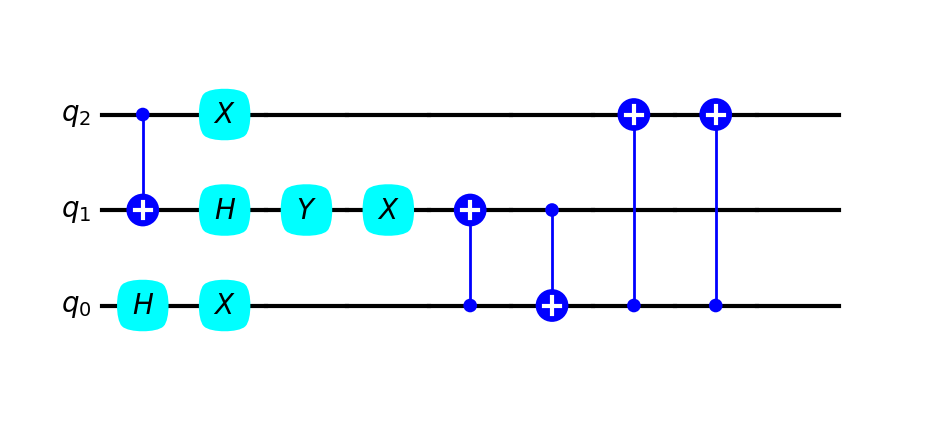
Ciruit exmaple with more qubits.
Issues ?
- dynamic figure size, adding more qubits messes up aspect ratio
- enhancing / limiting user customization
Plan for next week ?
- refactor the code in proper OOP
- add more gates
- make figure size dynamic wrt to addition of qubits
- make a color theme